
Buy stocks using Fibonacci Levels: Best way to average out your buying price
Fibonacci levels are best used to identify several zones.

In the world of trading, Fibonacci Levels are used by both retails traders as well as institutional trades.
It is actually the easiest way to identify reversal areas.
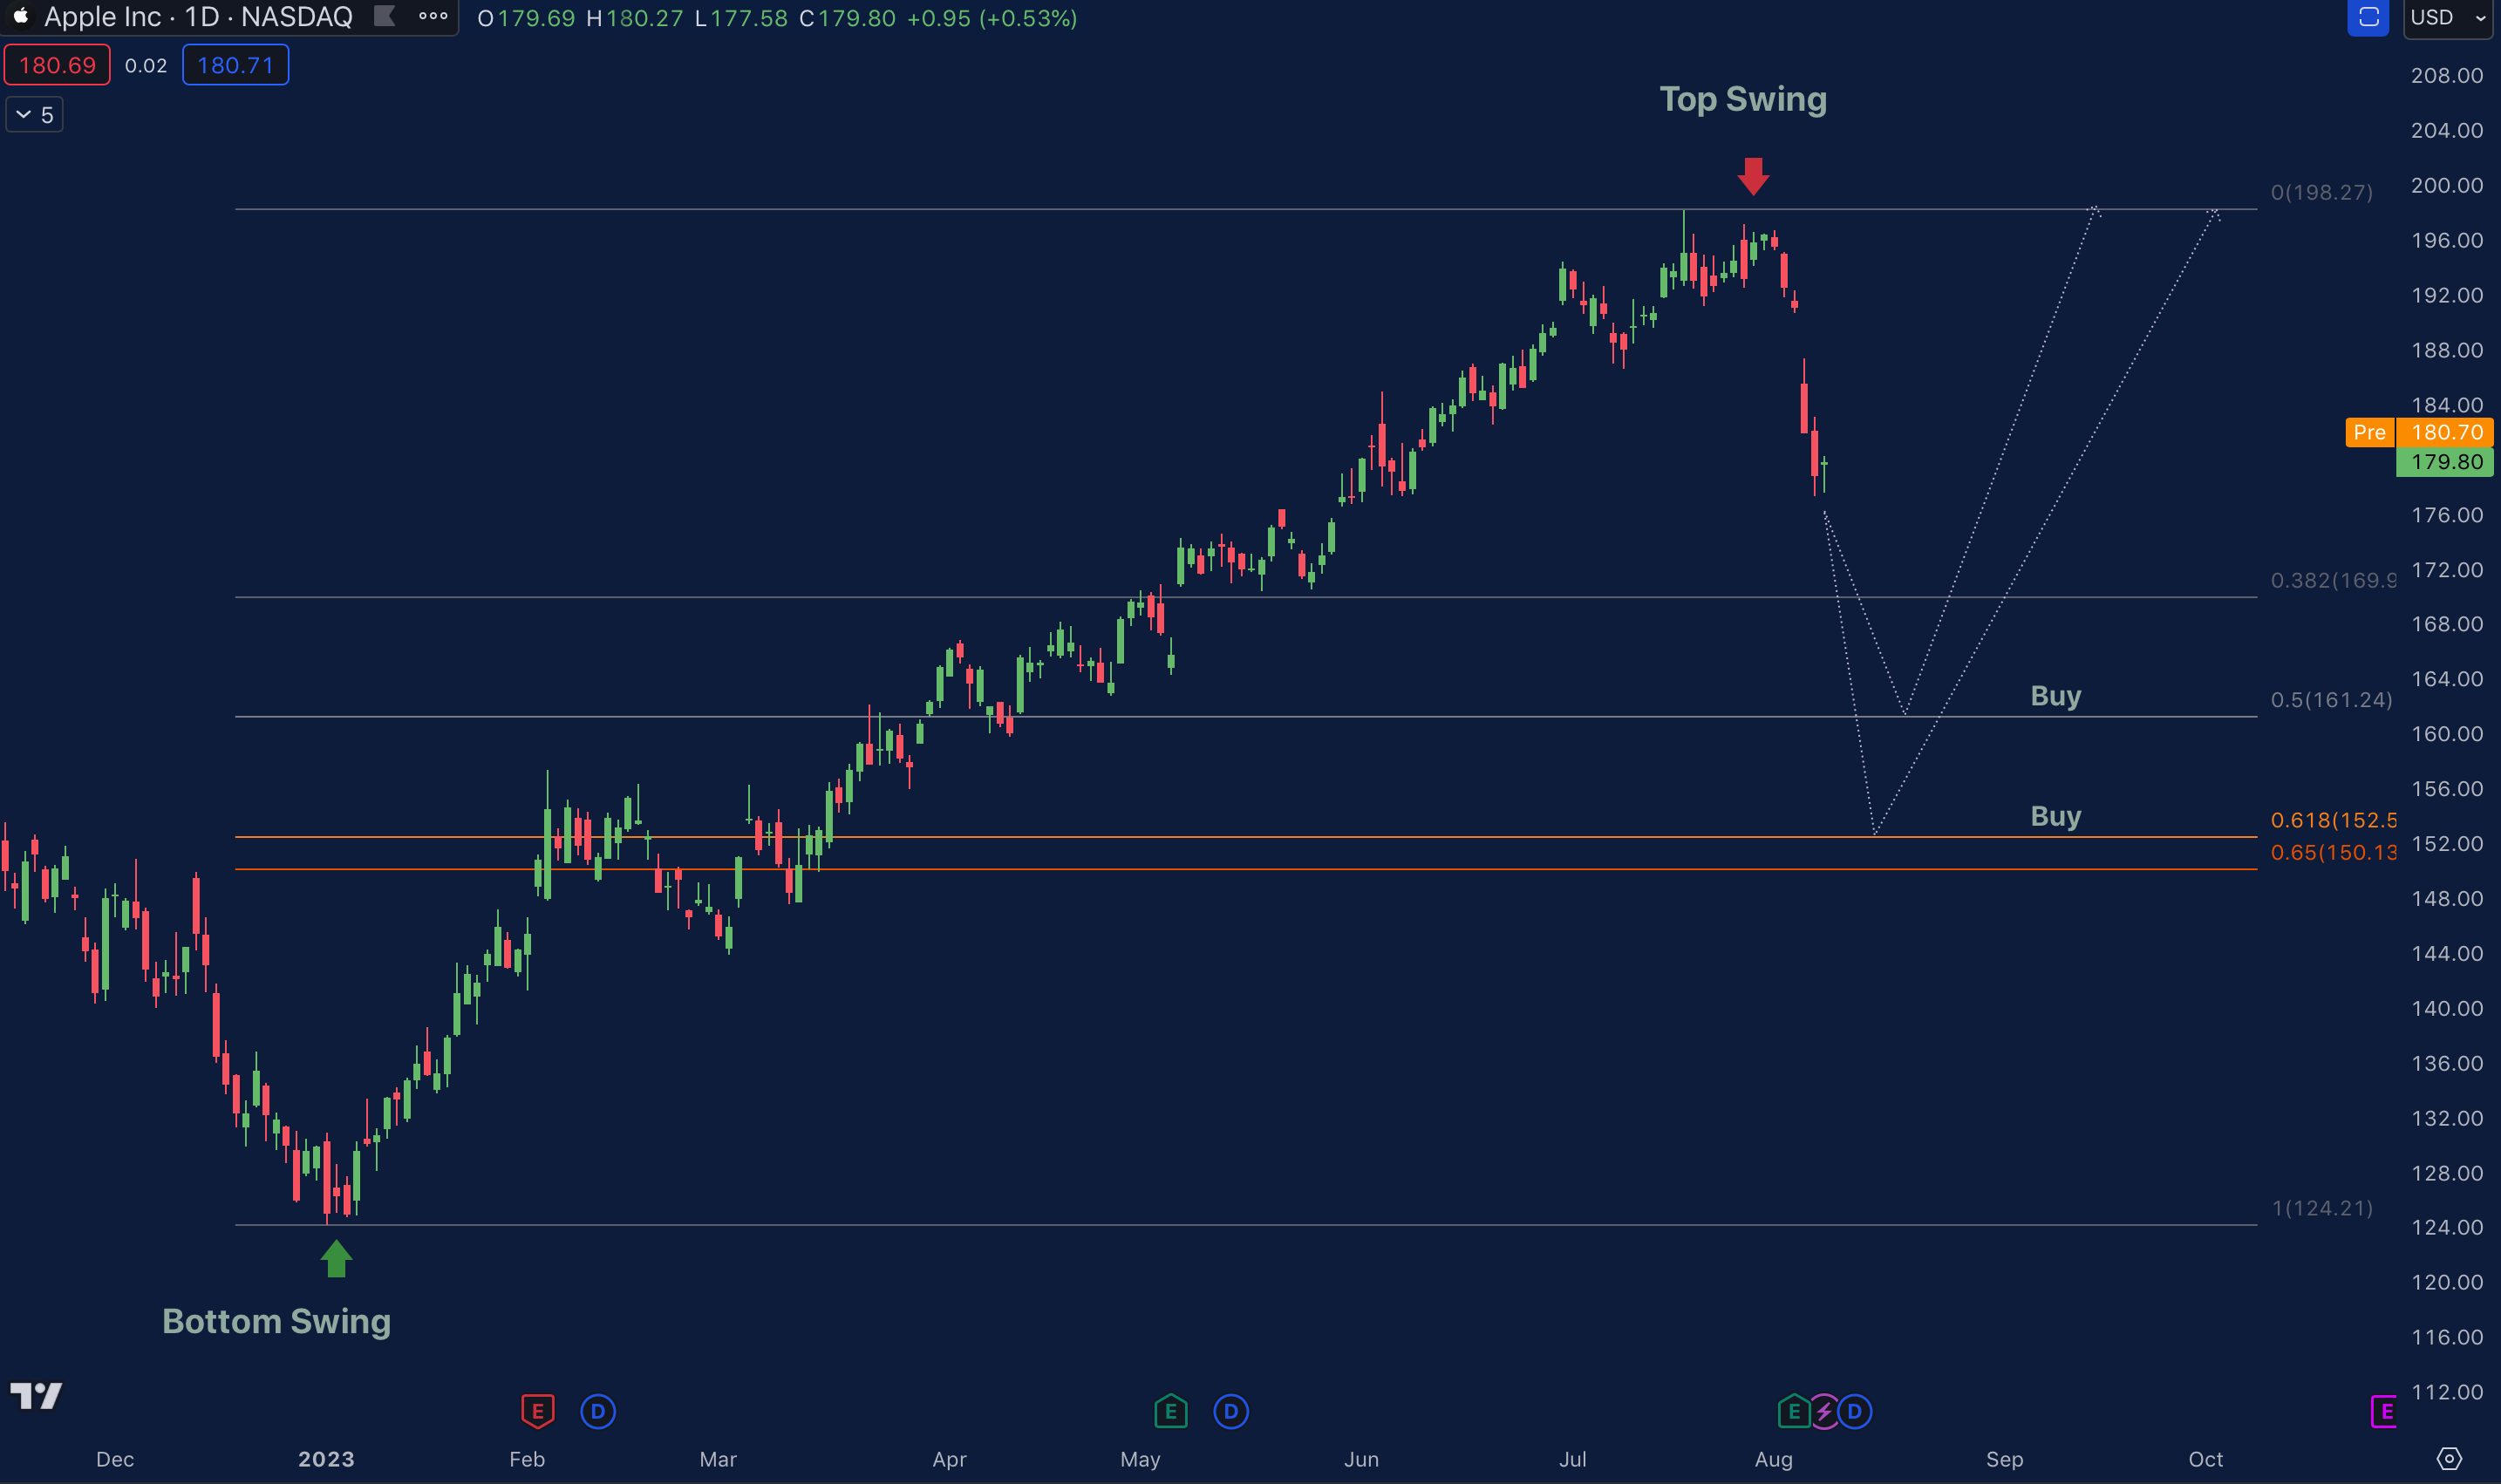
This is a Daily AAPL chart.
Here are the few steps to draw Fib Levels when price is an uptrend:
Identify a clear bottom swing (Indicated by the green arrow)
Identify a clear top swing (Indicated by the red arrow)
Take your Fib Tool, plot from bottom to top.
The Fib tool will give you a few key levels that you can use to average out your buying prices rather than buying blindly.
When price retraces back to the 0.5 level, it means that price has retraced 50%.
When price retraces back to the 0.61 - 0.65 level, it means price has retrace about 60%. The yellow zone is also known as ‘Golden Pocket.’
The golden pocket is a better reversal zone.
This is S&P 500 4 Hourly Chart.
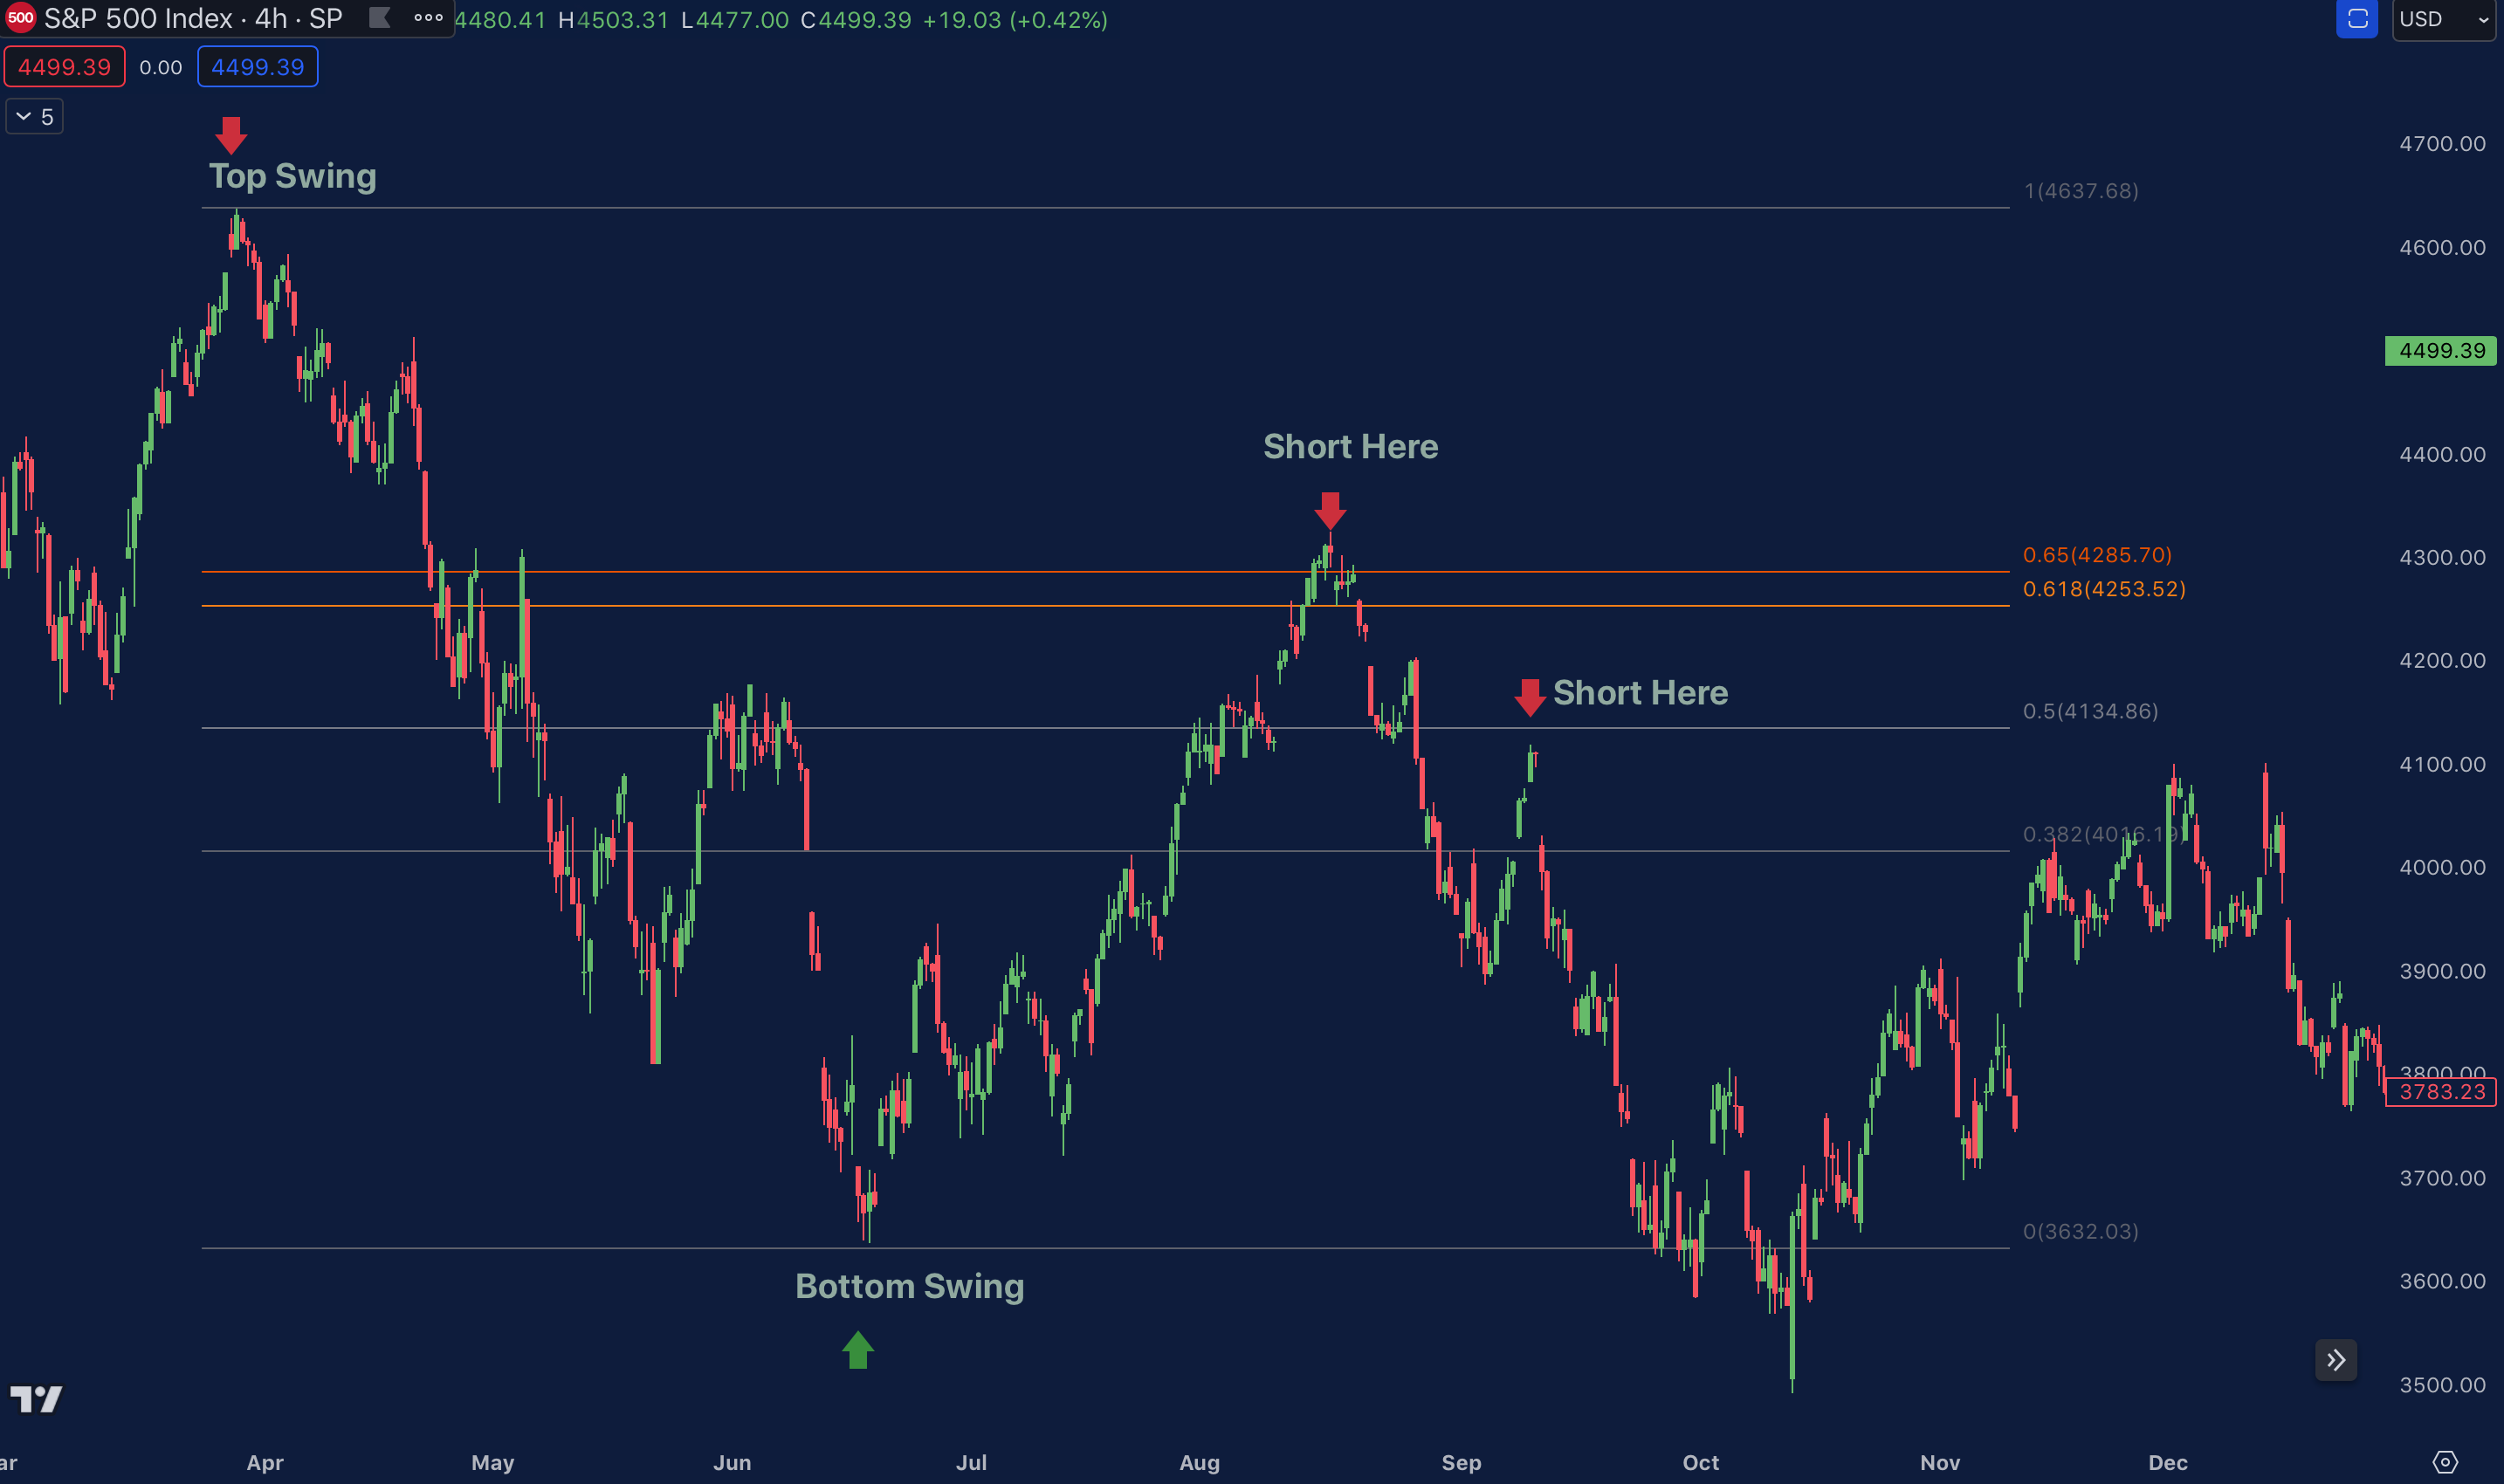
Here are the steps to draw Fib Levels when price is a down trend:
Identify a clear top swing (Indicated by the red arrow).
Identify a clear bottom swing (Indicated by the green arrow).
Take your Fib Tool, plot from top to bottom.
The rest of the conditions are the same.
When price retraces back to the golden pocket zone, 0.61 - 0.65 level, it’s best to short.
When price retraces back to the 0.5 level, we’d be a 50% retracement. We can add margin to our short.
Here are the Fib Level settings that I personally recommend:
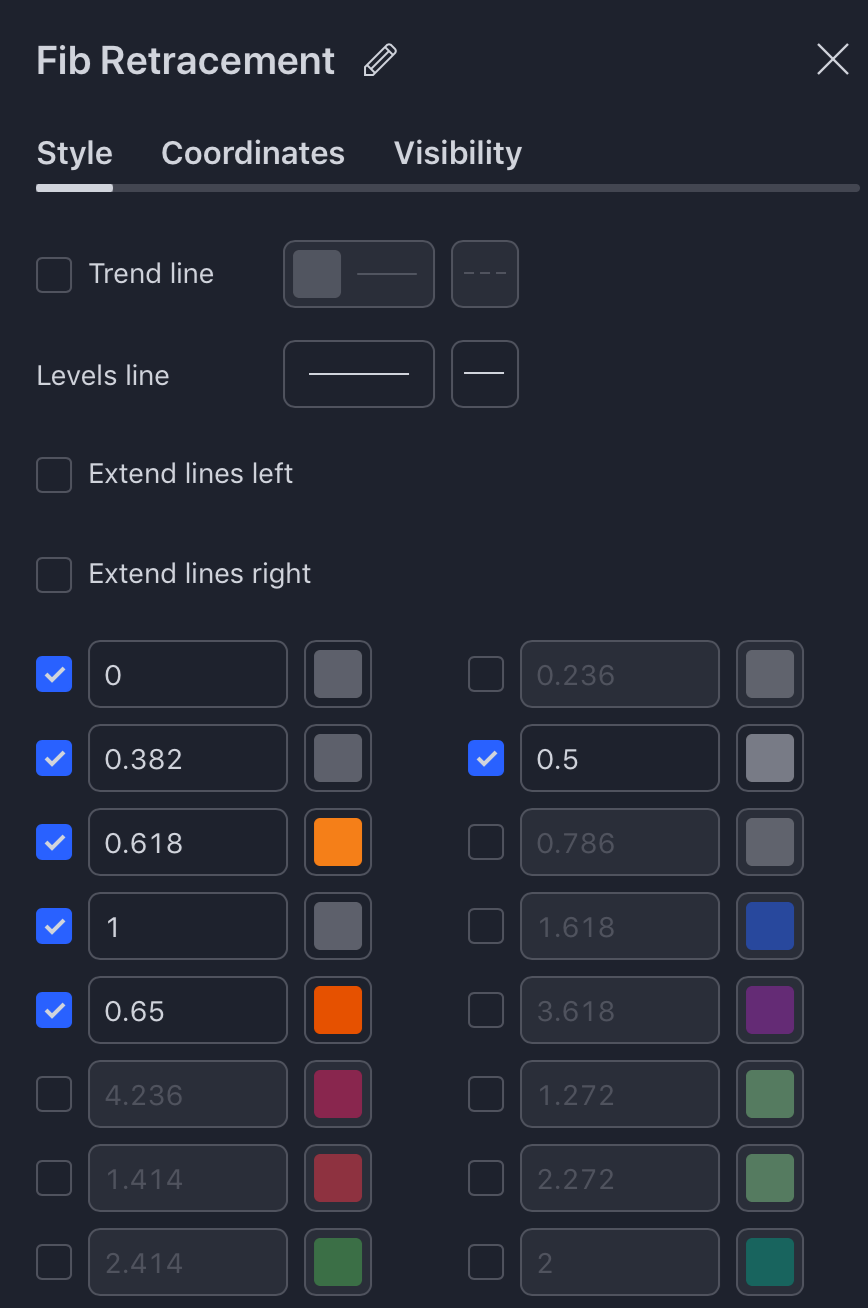
You can get rid of other unnecessary Fib levels. Keep only the key levels to make sure you have a clean chart.